
From a cursory glance, it’s difficult not to feel incredible anxiety toward Nutanix (NTNX). Billed as an enterprise cloud operating system, Nutanix combines server, storage, virtualization and networking software into one integrated solution. Given the surge in demand for AI workload management, one would expect NTNX stock to shoot higher. Unfortunately, the opposite has been the case.
Blame the events associated with the latest financial disclosure. On paper, Nutanix’s fiscal first quarter was mixed, with adjusted earnings per share of 41 cents meeting Wall Street’s expectations. However, the cloud services provider only posted revenue of $670.6 million, missing the consensus target of $676.4 million.
However, what really seemed to unravel sentiment for NTNX stock was the forward guidance. For Q2, management guided revenue to land between $705 million and $740 million, comparing badly to analysts’ consensus estimate of $749.09 million. Pouring salt on wounds, Nutanix also lowered the full-year revenue outlook.
Subsequently, investors rushed for the exits. In the trailing five sessions, NTNX stock fell more than 18%. In the past 30 days, it’s down almost 34%, an alarming figure. If all that wasn’t enough to convince you that something is seriously wrong, you just need to look at Barchart’s Technical Opinion indicator, which rates NTNX as a 100% Strong Sell.
Still, in the same breath, Barchart notes that the security’s relative strength indicator (RSI) is below the 20% level, indicating an oversold condition. As such, NTNX stock could be due for a reversal.
To be fair, options flow — which focuses exclusively on big block transactions likely placed by institutional investors — showed negative sentiment on Monday, as well as during the holiday-shortened week last week.
With so much bad news conspiring against NTNX stock, is the contrarian position worth exploring? If you’re a fan of advanced mathematics, the answer could be “yes.”
Leveraging the Power of Applied Calculus to Trade NTNX Stock
Under Ashby's Law of Requisite Variety, a methodology cannot be materially less complex than the environment it seeks to explain. It would be like expecting a classic video game console from the 1980s to produce lifelike graphics: it’s just not going to happen as the system is simply not capable of generating such details.
By the same token, it’s impossible to meaningfully analyze the equities market without calculus. The stock market is stochastic, chaotic, heteroskedastic, reflexive and yes, non-linear. That alone requires a mathematical model that measures non-linearity.
To help rectify this knowledge gap, I created a framework that I’m now calling trinitarian geometry, which combines probability theory (Kolmogorov), behavioral state transitions (Markov) and calculus (kernel density estimation or KDE). Essentially, we’re using these tools to identify and measure probability density, the point where prices tend to cluster under various circumstances.
Of course, the format is problematic, as a stock represents a singular journey across time. To address this issue, I implemented two processes: reification and iteration. At the core, we’re going to treat probability not as an abstract concept but as a physical object. By understanding the shape and structure of probability, we have an empirical idea of a security’s risk-reward profile.
However, in order to generate probabilities in the first place, price action must be segmented into multiple trials or sequences. Personally, I prefer 10-week sequences but the more important point is that the iteration is applied consistently throughout the dataset.
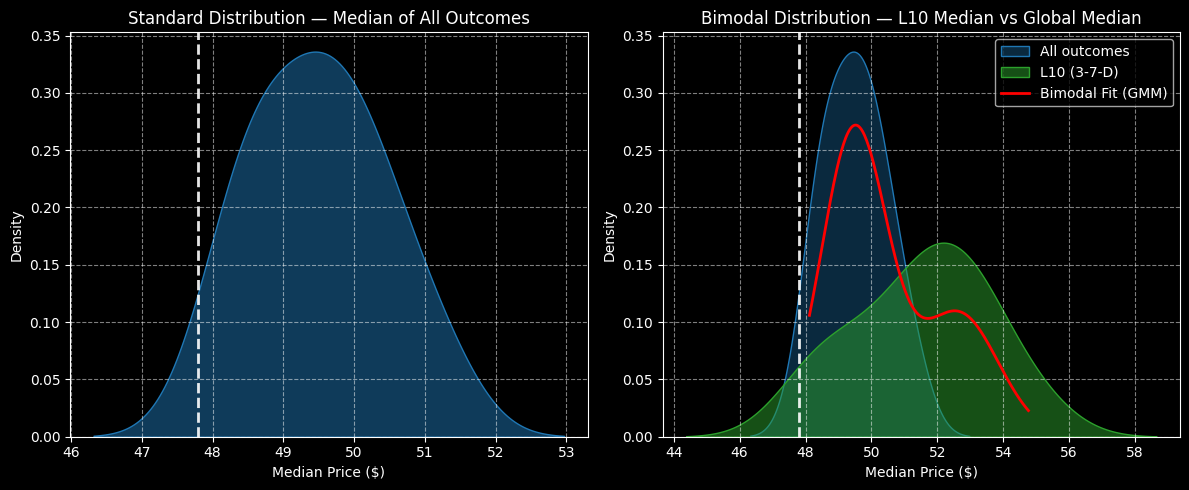
Using trinitarian geometry, we can arrange the forward 10-week returns of NTNX stock as a distributional curve, with outcomes ranging between $46.30 and $53 (assuming an anchor price of $47.80, Friday’s close). Further, price clustering should be predominant at $49.50.
The above assessment aggregates all trials since January 2019. However, under the principle of heteroskedasticity, we’re interested in a specific signal, the 3-7-D sequence; that is, in the past 10 weeks ending Friday, NTNX stock printed three up weeks and seven down weeks, with an overall downward slope.
Under this setup, NTNX’s forward 10-week returns shift conspicuously, with outcomes likely to range between $44.20 and $58. Moreover, price clustering would likely be predominant at $52.10. Effectively, there’s a 5.25% positive variance between the outcome the market expects versus what is conditionally likely.
That right there could be a structural arbitrage that adventurous traders may be able to exploit.
Going for a High-Risk Trade
If we’re operating strictly by the numbers, the most sensible idea is arguably the 45.00/52.50 bull call spread expiring Jan. 16, 2026. This trade will require NTNX stock to rise through the second-leg strike ($52.50) at expiration, which is a realistic target if we believe that the statistical narrative will play out as expected.

However, the most aggressive idea that could tickle your fancy is the 50/55 bull spread, also expiring Jan. 16. This trade requires NTNX stock to hit $55 at expiration, which is on the north end of the 3-7-D sequence’s distributional curve. While that’s aggressive, the breakeven price is $51.50, which should be in play.
If it were me, I’d be lying if I said I wasn’t intrigued. Yes, the spread with the $52.50 leg is much more realistic. However, if NTNX stock performs a dead-cat bounce, the capping of reward at a lower leg may lead to a sharp opportunity cost.
With the $55 leg, it would give me the opportunity to “fight” for a much higher payout, which stands at over 233%. That’s going to make anyone think a little more.
On the date of publication, Josh Enomoto did not have (either directly or indirectly) positions in any of the securities mentioned in this article. All information and data in this article is solely for informational purposes. For more information please view the Barchart Disclosure Policy here.
More news from Barchart