

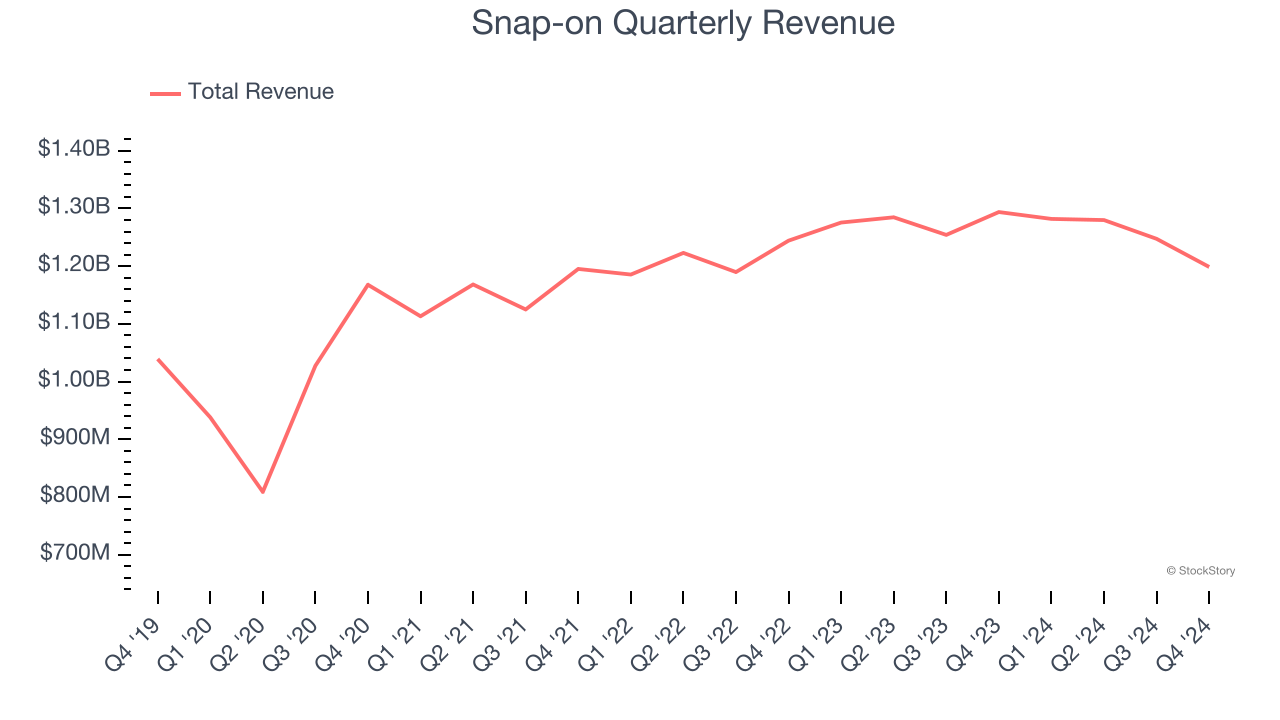
Professional tools and equipment manufacturer Snap-on (NYSE:SNA) missed Wall Street’s revenue expectations in Q4 CY2024, with sales falling 7.4% year on year to $1.20 billion. Its GAAP profit of $4.82 per share was 0.5% above analysts’ consensus estimates.
Is now the time to buy Snap-on? Find out by accessing our full research report, it’s free.
Snap-on (SNA) Q4 CY2024 Highlights:
- Revenue: $1.20 billion vs analyst estimates of $1.30 billion (7.4% year-on-year decline, 7.8% miss)
- EPS (GAAP): $4.82 vs analyst estimates of $4.79 (0.5% beat)
- Adjusted EBITDA: $296.6 million vs analyst estimates of $361.4 million (24.7% margin, 17.9% miss)
- Operating Margin: 22.1%, down from 25.2% in the same quarter last year
- Free Cash Flow Margin: 23%, up from 18.1% in the same quarter last year
- Organic Revenue fell 1.4% year on year (-5.7% in the same quarter last year)
- Market Capitalization: $18.69 billion
“We are encouraged by our fourth quarter results as our businesses were again strong, achieving a positive balance and overall progress, with our operations serving critical industries and repair shop owners and managers advancing in both sales and profitability, and with the Snap-on Tools Group continuing to narrow the gap versus prior periods despite the environment of general uncertainty,” said Nick Pinchuk, Snap-on chairman and chief executive officer.
Company Overview
Founded in 1920, Snap-on (NYSE:SNA) is a global provider of tools, equipment, and diagnostics for various industries such as vehicle repair, aerospace, and the military.
Professional Tools and Equipment
Automation that increases efficiency and connected equipment that collects analyzable data have been trending, creating new demand. Some professional tools and equipment companies also provide software to accompany measurement or automated machinery, adding a stream of recurring revenues to their businesses. On the other hand, professional tools and equipment companies are at the whim of economic cycles. Consumer spending and interest rates, for example, can greatly impact the industrial production that drives demand for these companies’ offerings.
Sales Growth
A company’s long-term sales performance signals its overall quality. Even a bad business can shine for one or two quarters, but a top-tier one grows for years. Regrettably, Snap-on’s sales grew at a sluggish 4.2% compounded annual growth rate over the last five years. This fell short of our benchmark for the industrials sector and is a tough starting point for our analysis.
We at StockStory place the most emphasis on long-term growth, but within industrials, a half-decade historical view may miss cycles, industry trends, or a company capitalizing on catalysts such as a new contract win or a successful product line. Snap-on’s recent history shows its demand slowed as its annualized revenue growth of 1.7% over the last two years is below its five-year trend. 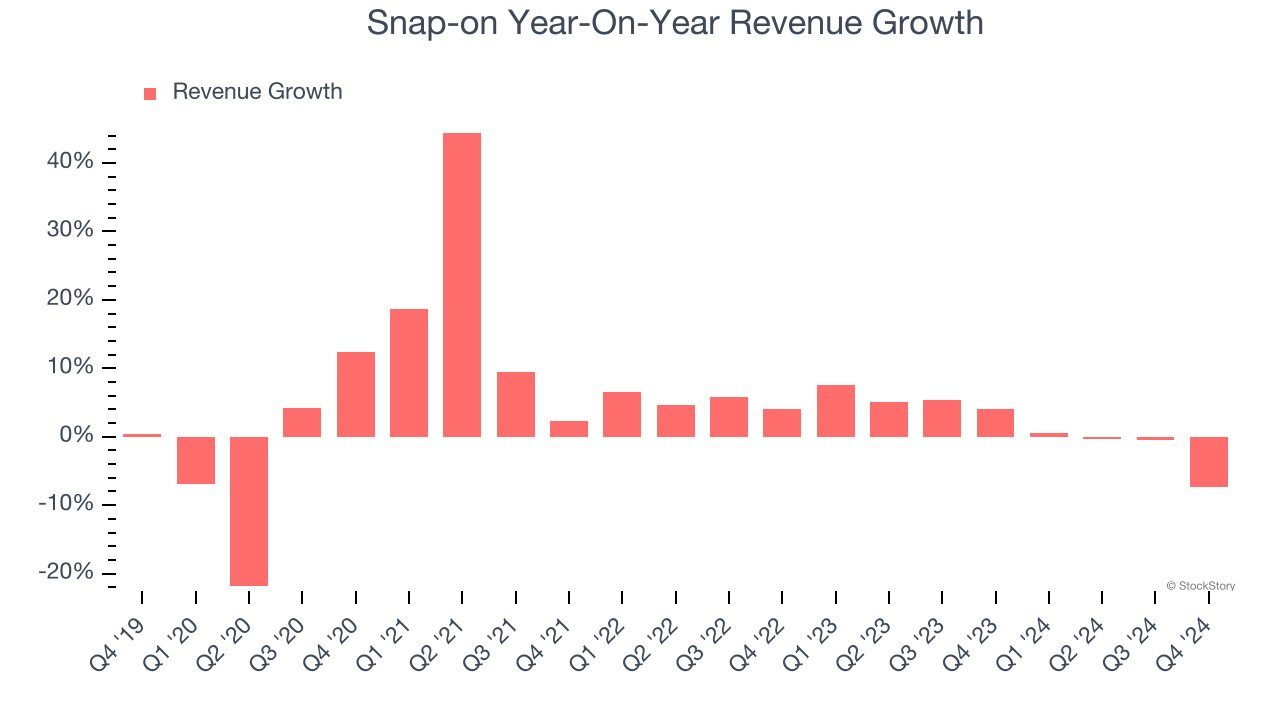
We can dig further into the company’s sales dynamics by analyzing its organic revenue, which strips out one-time events like acquisitions and currency fluctuations that don’t accurately reflect its fundamentals. Over the last two years, Snap-on’s organic revenue averaged 1.7% year-on-year declines. Because this number is lower than its normal revenue growth, we can see that some mixture of acquisitions and foreign exchange rates boosted its headline results. 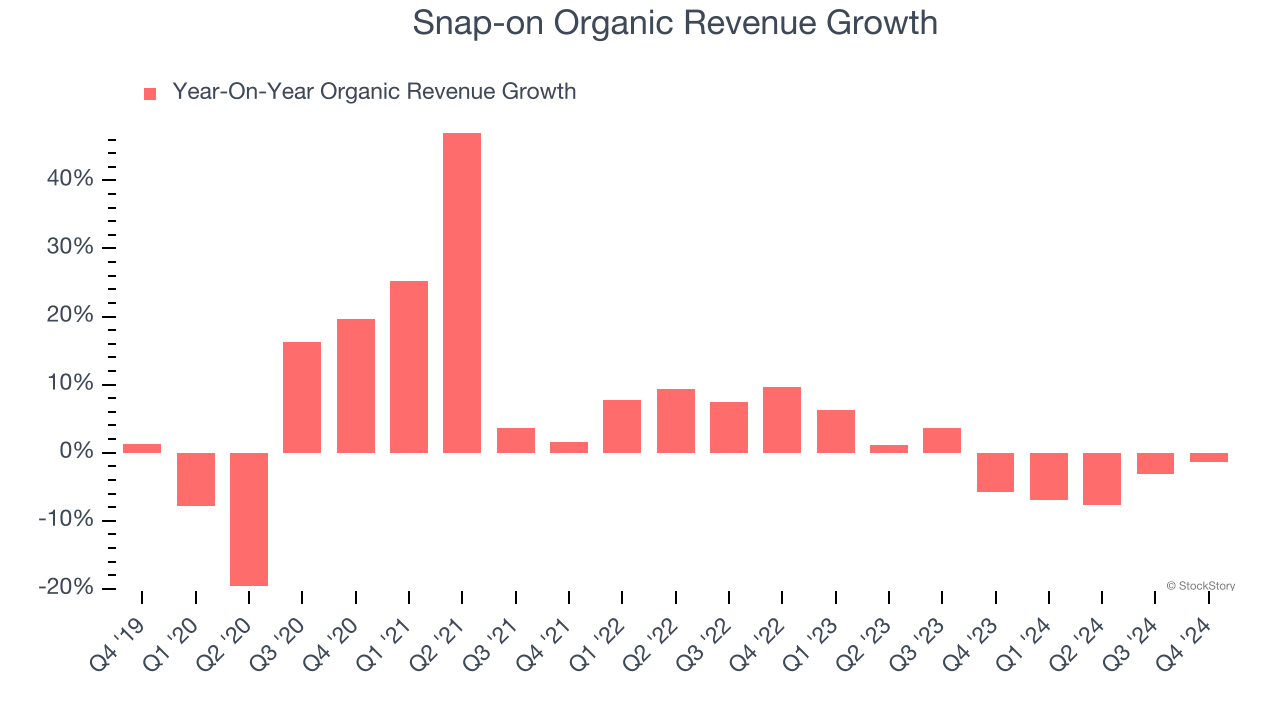
This quarter, Snap-on missed Wall Street’s estimates and reported a rather uninspiring 7.4% year-on-year revenue decline, generating $1.20 billion of revenue.
Looking ahead, sell-side analysts expect revenue to grow 5.7% over the next 12 months. Although this projection suggests its newer products and services will fuel better top-line performance, it is still below average for the sector.
Today’s young investors won’t have read the timeless lessons in Gorilla Game: Picking Winners In High Technology because it was written more than 20 years ago when Microsoft and Apple were first establishing their supremacy. But if we apply the same principles, then enterprise software stocks leveraging their own generative AI capabilities may well be the Gorillas of the future. So, in that spirit, we are excited to present our Special Free Report on a profitable, fast-growing enterprise software stock that is already riding the automation wave and looking to catch the generative AI next.
Operating Margin
Snap-on has been a well-oiled machine over the last five years. It demonstrated elite profitability for an industrials business, boasting an average operating margin of 24.7%. This result isn’t surprising as its high gross margin gives it a favorable starting point.
Looking at the trend in its profitability, Snap-on’s operating margin rose by 3.2 percentage points over the last five years, showing its efficiency has improved.
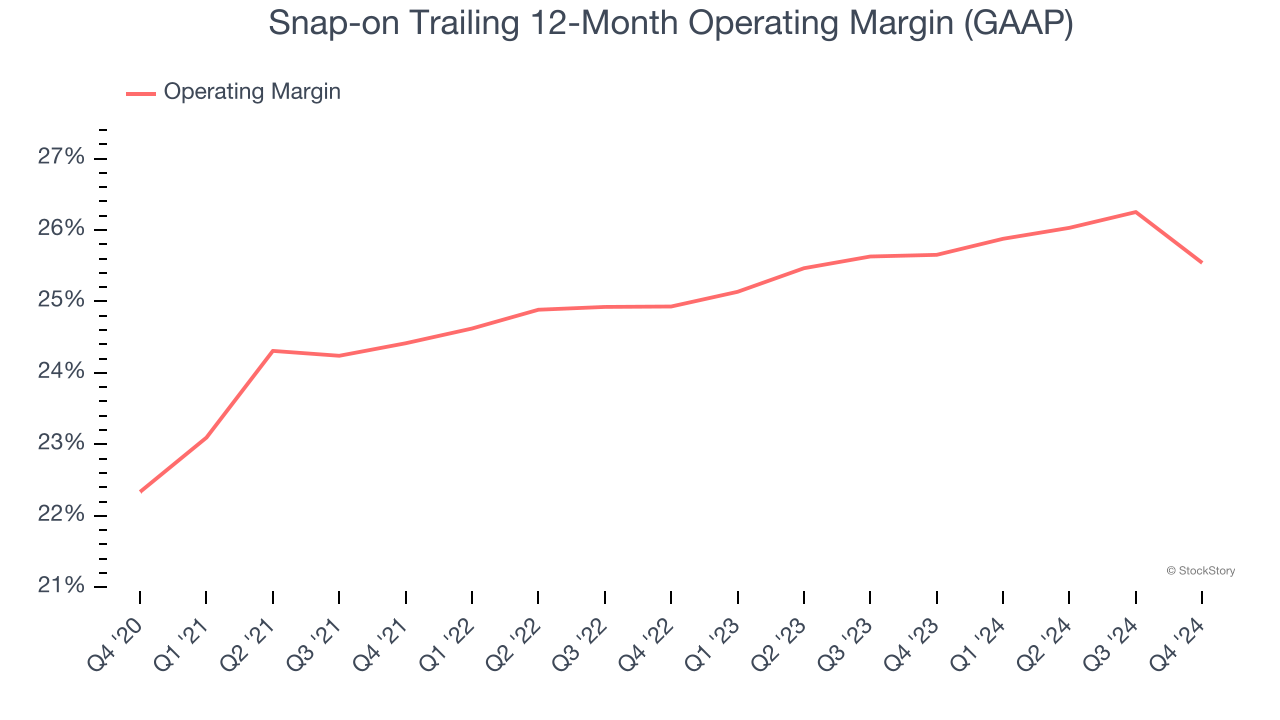
This quarter, Snap-on generated an operating profit margin of 22.1%, down 3.1 percentage points year on year. Since Snap-on’s operating margin decreased more than its gross margin, we can assume it was recently less efficient because expenses such as marketing, R&D, and administrative overhead increased.
Earnings Per Share
Revenue trends explain a company’s historical growth, but the long-term change in earnings per share (EPS) points to the profitability of that growth – for example, a company could inflate its sales through excessive spending on advertising and promotions.
Snap-on’s EPS grew at a decent 9.4% compounded annual growth rate over the last five years, higher than its 4.2% annualized revenue growth. This tells us the company became more profitable on a per-share basis as it expanded.
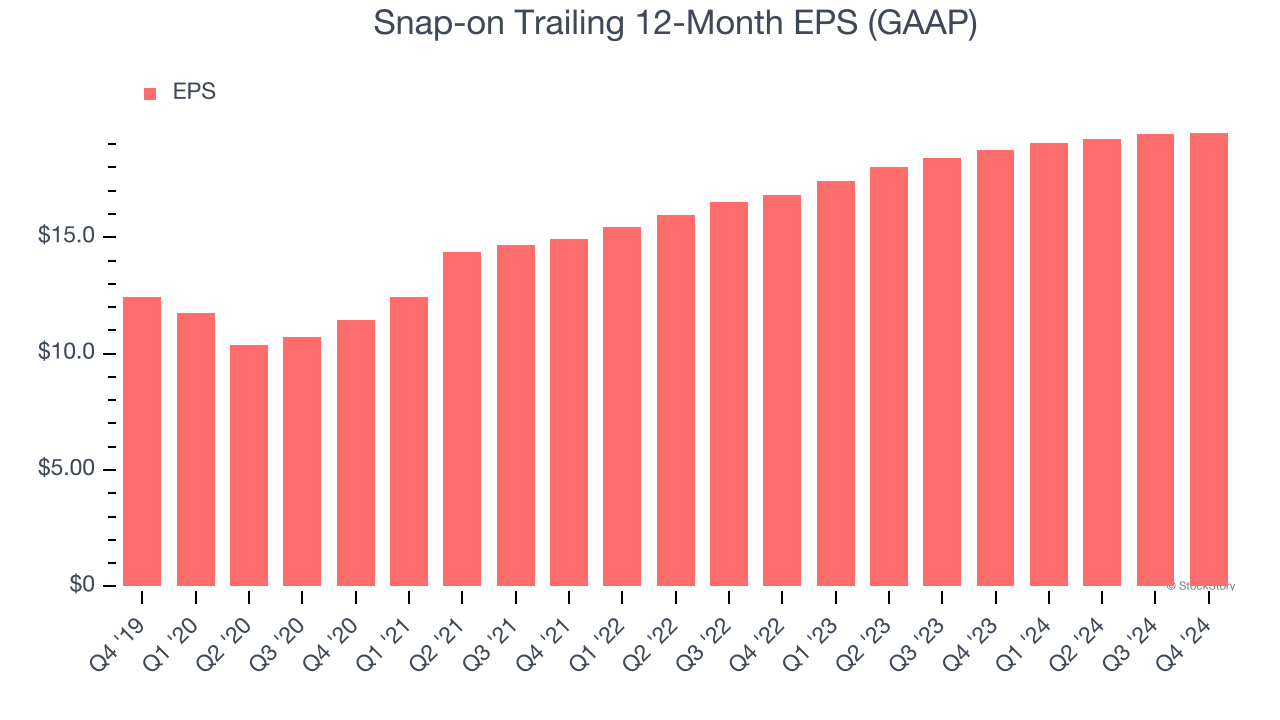
We can take a deeper look into Snap-on’s earnings to better understand the drivers of its performance. As we mentioned earlier, Snap-on’s operating margin declined this quarter but expanded by 3.2 percentage points over the last five years. Its share count also shrank by 3.4%, and these factors together are positive signs for shareholders because improving profitability and share buybacks turbocharge EPS growth relative to revenue growth. 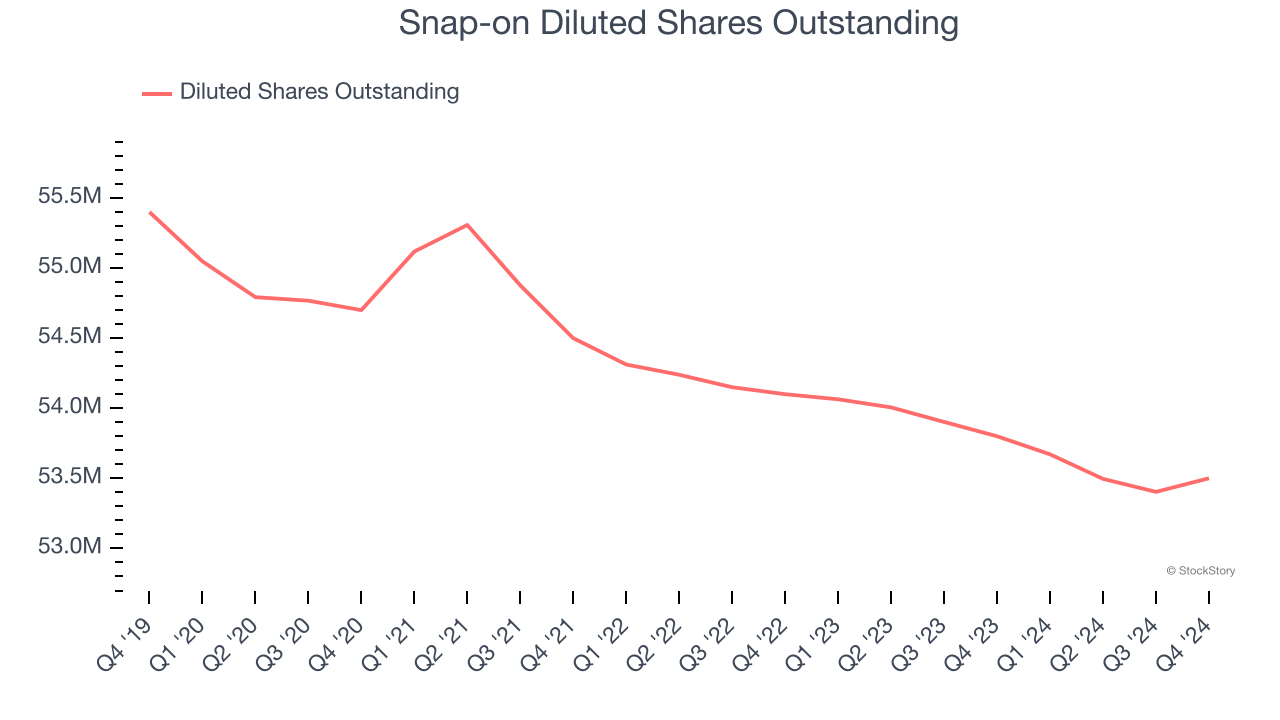
Like with revenue, we analyze EPS over a shorter period to see if we are missing a change in the business.
For Snap-on, its two-year annual EPS growth of 7.6% was lower than its five-year trend. We hope its growth can accelerate in the future.
In Q4, Snap-on reported EPS at $4.82, up from $4.75 in the same quarter last year. This print was close to analysts’ estimates. Over the next 12 months, Wall Street expects Snap-on’s full-year EPS of $19.50 to grow 3.9%.
Key Takeaways from Snap-on’s Q4 Results
We struggled to find many positives in these results. Its revenue missed significantly and its EBITDA fell short of Wall Street’s estimates. Overall, this was a weaker quarter. The stock traded down 4.7% to $340.01 immediately following the results.
Snap-on may have had a tough quarter, but does that actually create an opportunity to invest right now? If you’re making that decision, you should consider the bigger picture of valuation, business qualities, as well as the latest earnings. We cover that in our actionable full research report which you can read here, it’s free.