

Home and security products company Fortune Brands (NYSE:FBIN) missed Wall Street’s revenue expectations in Q4 CY2024, with sales falling 4.9% year on year to $1.10 billion. Its GAAP profit of $0.84 per share was 20.1% below analysts’ consensus estimates.
Is now the time to buy Fortune Brands? Find out by accessing our full research report, it’s free.
Fortune Brands (FBIN) Q4 CY2024 Highlights:
- Revenue: $1.10 billion vs analyst estimates of $1.14 billion (4.9% year-on-year decline, 3.5% miss)
- EPS (GAAP): $0.84 vs analyst expectations of $1.05 (20.1% miss)
- Adjusted EBITDA: $227.2 million vs analyst estimates of $242.3 million (20.6% margin, 6.2% miss)
- EPS (GAAP) guidance for the upcoming financial year 2025 is $4.30 at the midpoint, missing analyst estimates by 4.2%
- Operating Margin: 16.1%, up from 11.5% in the same quarter last year
- Free Cash Flow Margin: 19.2%, up from 12% in the same quarter last year
- Organic Revenue fell 1% year on year (-4.6% in the same quarter last year)
- Market Capitalization: $8.62 billion
Company Overview
Targeting a wide customer base of residential and commercial customers, Fortune Brands (NYSE:FBIN) makes plumbing, security, and outdoor living products.
Home Construction Materials
Traditionally, home construction materials companies have built economic moats with expertise in specialized areas, brand recognition, and strong relationships with contractors. More recently, advances to address labor availability and job site productivity have spurred innovation that is driving incremental demand. However, these companies are at the whim of residential construction volumes, which tend to be cyclical and can be impacted heavily by economic factors such as interest rates. Additionally, the costs of raw materials can be driven by a myriad of worldwide factors and greatly influence the profitability of home construction materials companies.
Sales Growth
A company’s long-term sales performance can indicate its overall quality. Any business can put up a good quarter or two, but many enduring ones grow for years. Unfortunately, Fortune Brands’s 6.4% annualized revenue growth over the last five years was mediocre. This fell short of our benchmark for the industrials sector and is a poor baseline for our analysis.
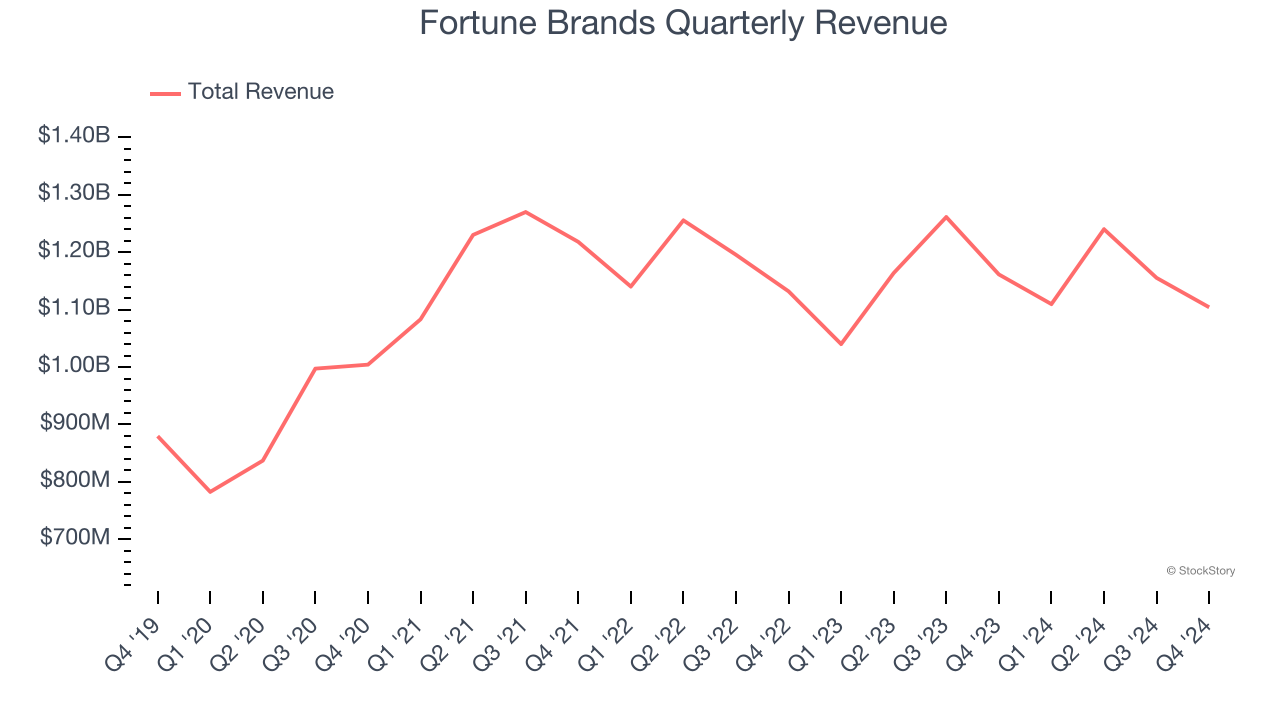
Long-term growth is the most important, but within industrials, a half-decade historical view may miss new industry trends or demand cycles. Fortune Brands’s history shows it grew in the past but relinquished its gains over the last two years, as its revenue fell by 1.2% annually. 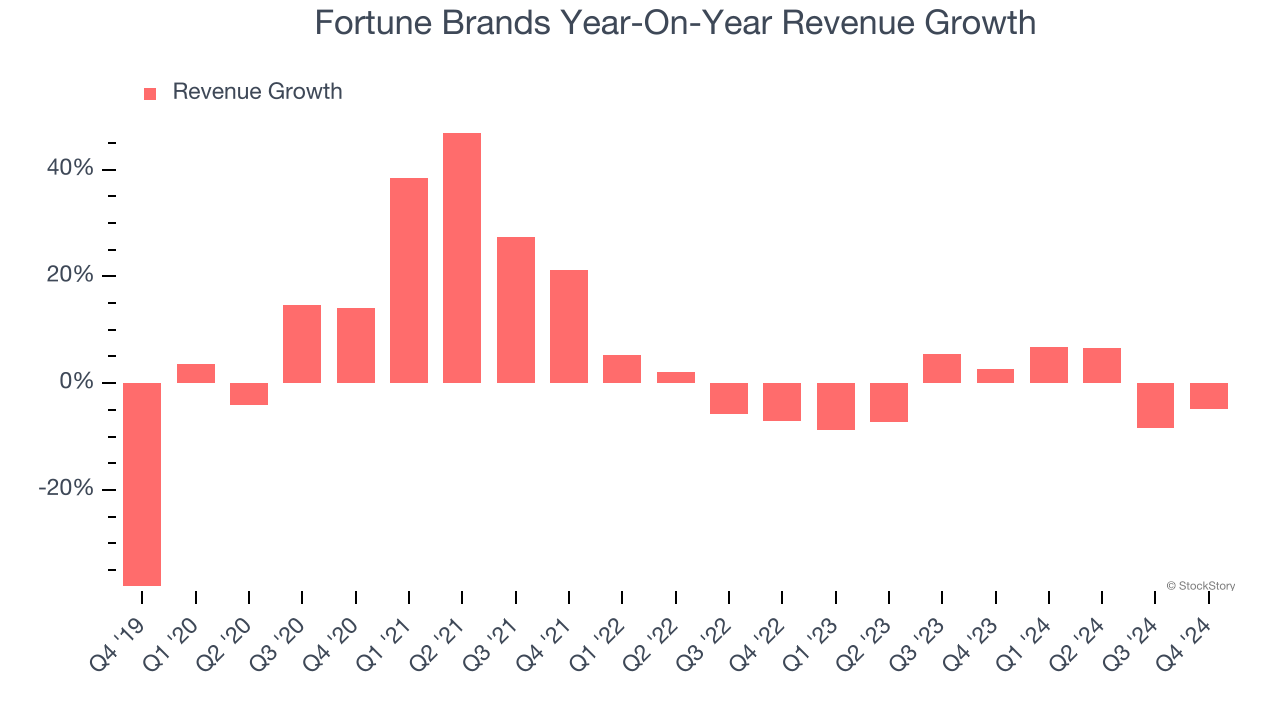
Fortune Brands also reports organic revenue, which strips out one-time events like acquisitions and currency fluctuations that don’t accurately reflect its fundamentals. Over the last two years, Fortune Brands’s organic revenue averaged 4.1% year-on-year declines. Because this number is lower than its normal revenue growth, we can see that some mixture of acquisitions and foreign exchange rates boosted its headline results. 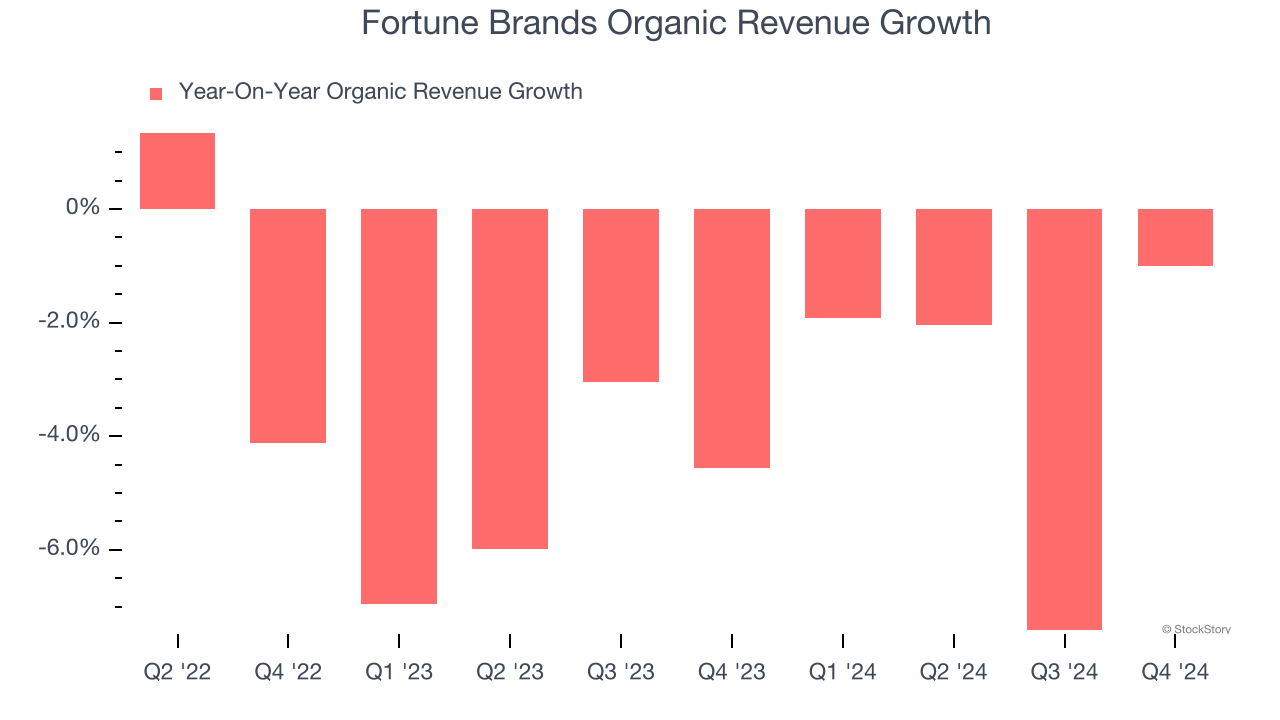
This quarter, Fortune Brands missed Wall Street’s estimates and reported a rather uninspiring 4.9% year-on-year revenue decline, generating $1.10 billion of revenue.
Looking ahead, sell-side analysts expect revenue to grow 3.6% over the next 12 months. While this projection indicates its newer products and services will fuel better top-line performance, it is still below average for the sector.
Today’s young investors won’t have read the timeless lessons in Gorilla Game: Picking Winners In High Technology because it was written more than 20 years ago when Microsoft and Apple were first establishing their supremacy. But if we apply the same principles, then enterprise software stocks leveraging their own generative AI capabilities may well be the Gorillas of the future. So, in that spirit, we are excited to present our Special Free Report on a profitable, fast-growing enterprise software stock that is already riding the automation wave and looking to catch the generative AI next.
Operating Margin
Operating margin is an important measure of profitability as it shows the portion of revenue left after accounting for all core expenses – everything from the cost of goods sold to advertising and wages. It’s also useful for comparing profitability across companies with different levels of debt and tax rates because it excludes interest and taxes.
Fortune Brands has been a well-oiled machine over the last five years. It demonstrated elite profitability for an industrials business, boasting an average operating margin of 17.7%. This result was particularly impressive because of its low gross margin, which is mostly a factor of what it sells and takes huge shifts to move meaningfully. Companies have more control over their operating margins, and it’s a show of well-managed operations if they’re high when gross margins are low.
Analyzing the trend in its profitability, Fortune Brands’s operating margin decreased by 6.1 percentage points over the last five years. Even though its historical margin is high, shareholders will want to see Fortune Brands become more profitable in the future.
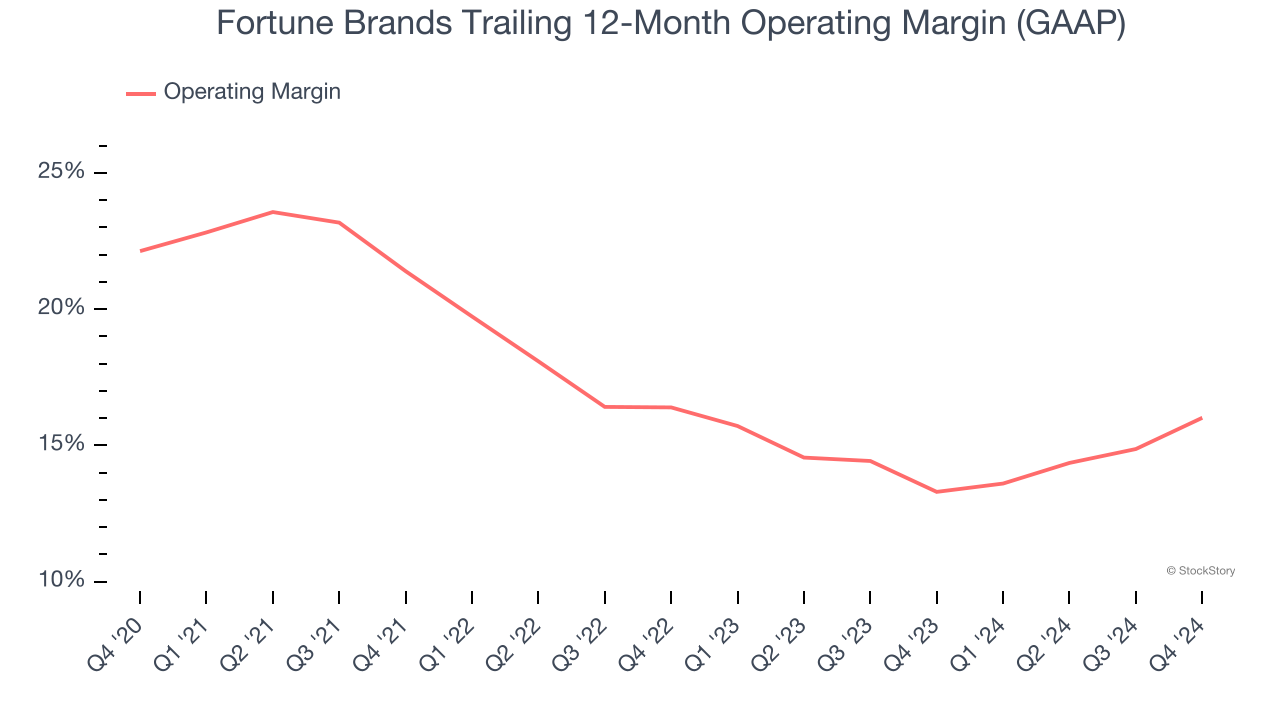
In Q4, Fortune Brands generated an operating profit margin of 16.1%, up 4.6 percentage points year on year. The increase was encouraging, and since its operating margin rose more than its gross margin, we can infer it was recently more efficient with expenses such as marketing, R&D, and administrative overhead.
Earnings Per Share
Revenue trends explain a company’s historical growth, but the long-term change in earnings per share (EPS) points to the profitability of that growth – for example, a company could inflate its sales through excessive spending on advertising and promotions.
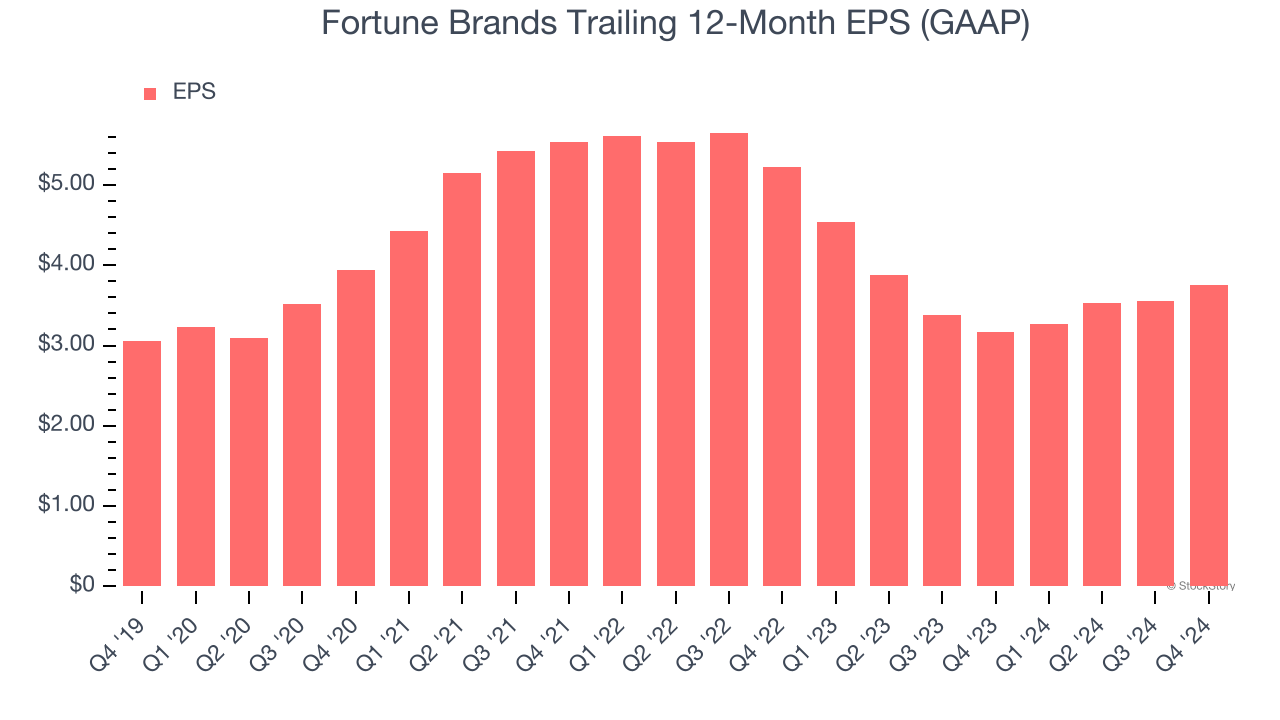
Fortune Brands’s EPS grew at an unimpressive 4.2% compounded annual growth rate over the last five years, lower than its 6.4% annualized revenue growth. This tells us the company became less profitable on a per-share basis as it expanded due to non-fundamental factors such as interest expenses and taxes.
We can take a deeper look into Fortune Brands’s earnings to better understand the drivers of its performance. As we mentioned earlier, Fortune Brands’s operating margin improved this quarter but declined by 6.1 percentage points over the last five years. This was the most relevant factor (aside from the revenue impact) behind its lower earnings; taxes and interest expenses can also affect EPS but don’t tell us as much about a company’s fundamentals.
Like with revenue, we analyze EPS over a more recent period because it can provide insight into an emerging theme or development for the business.
For Fortune Brands, its two-year annual EPS declines of 15.2% show it’s continued to underperform. These results were bad no matter how you slice the data.
In Q4, Fortune Brands reported EPS at $0.84, up from $0.64 in the same quarter last year. Despite growing year on year, this print missed analysts’ estimates. Over the next 12 months, Wall Street expects Fortune Brands’s full-year EPS of $3.76 to grow 20.6%.
Key Takeaways from Fortune Brands’s Q4 Results
It was good to see Fortune Brands narrowly top analysts’ organic revenue expectations this quarter. On the other hand, its full-year EPS guidance missed significantly and its revenue fell short of Wall Street’s estimates. Overall, this quarter could have been better. The stock traded down 3% to $67 immediately after reporting.
Fortune Brands’s earnings report left more to be desired. Let’s look forward to see if this quarter has created an opportunity to buy the stock. When making that decision, it’s important to consider its valuation, business qualities, as well as what has happened in the latest quarter. We cover that in our actionable full research report which you can read here, it’s free.